
We are pleased to share with you the first edition of our semi-annual KPMG Working Capital Report (WC Report), alongside the KPMG Financial Performance Index (FPI). We intend to provide our insights into the changing state of corporate conditions across all Indonesian markets and sectors from the end of the reporting season until June 2024. KPMG WC Report data is refreshed on a quarterly basis, and our analysis is presented every six months.
This report aims to help businesses navigate through Indonesia’s rapidly changing economic outlook, since working capital management is essential for growth and financial stability. This report offers insights into working capital metrics across different sectors. Optimizing inventory, receivables, and payables can lead to increased liquidity, additional financing for strategic expansion, M&A, faster debt repayment, and funding for performance enhancement programs. Effective working capital management can increase cash flow and mitigate risks for businesses.
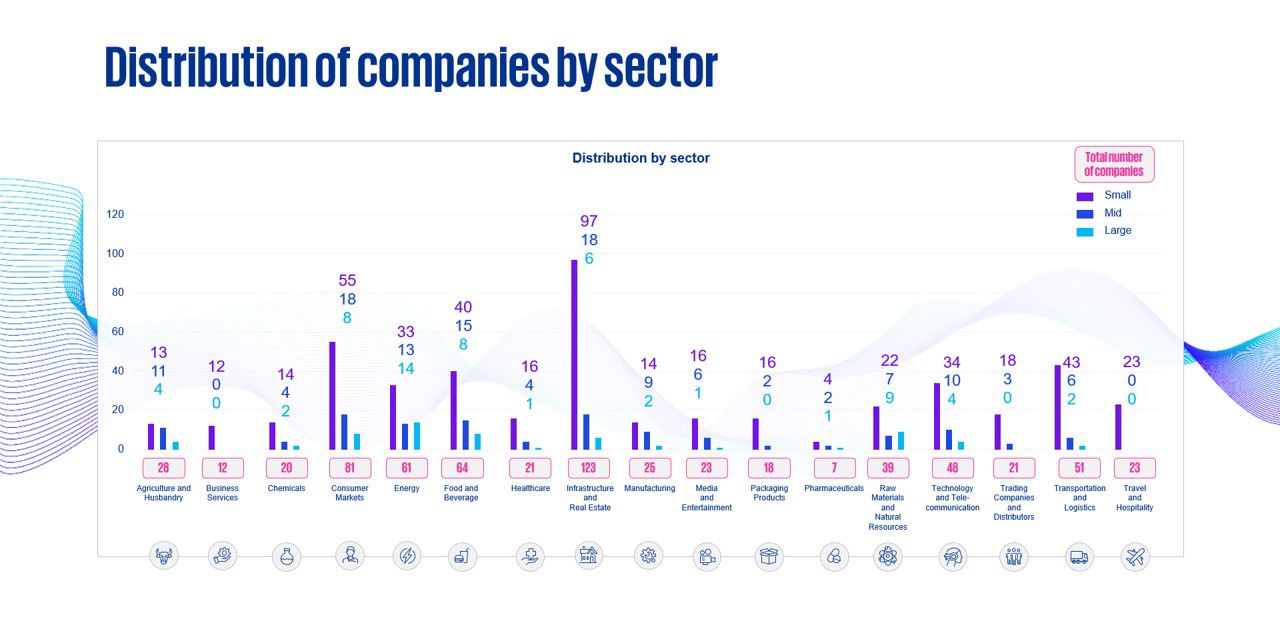
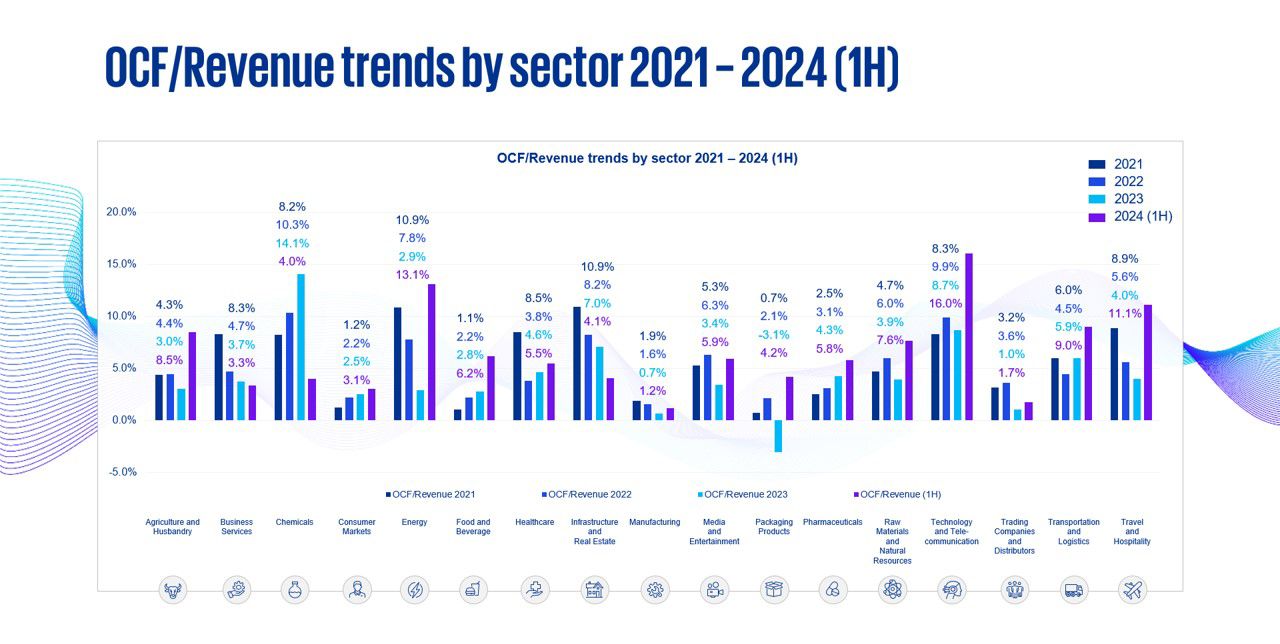
We have analyzed the performance of over 780 publicly listed companies across 18 sectors in Indonesia from 2021 to the first half of 2024 to provide stakeholders with detailed trend analyses across a variety of working capital and other performance measures. This allows companies, their creditors, and other stakeholders to easily benchmark how they stack up against their industry peers.
Anylisis - Findings
- The figures for each industry are mostly determined by their distinct characteristics, such as their general operational structures or overall business model. But within this study, certain noteworthy tendencies have emerged.
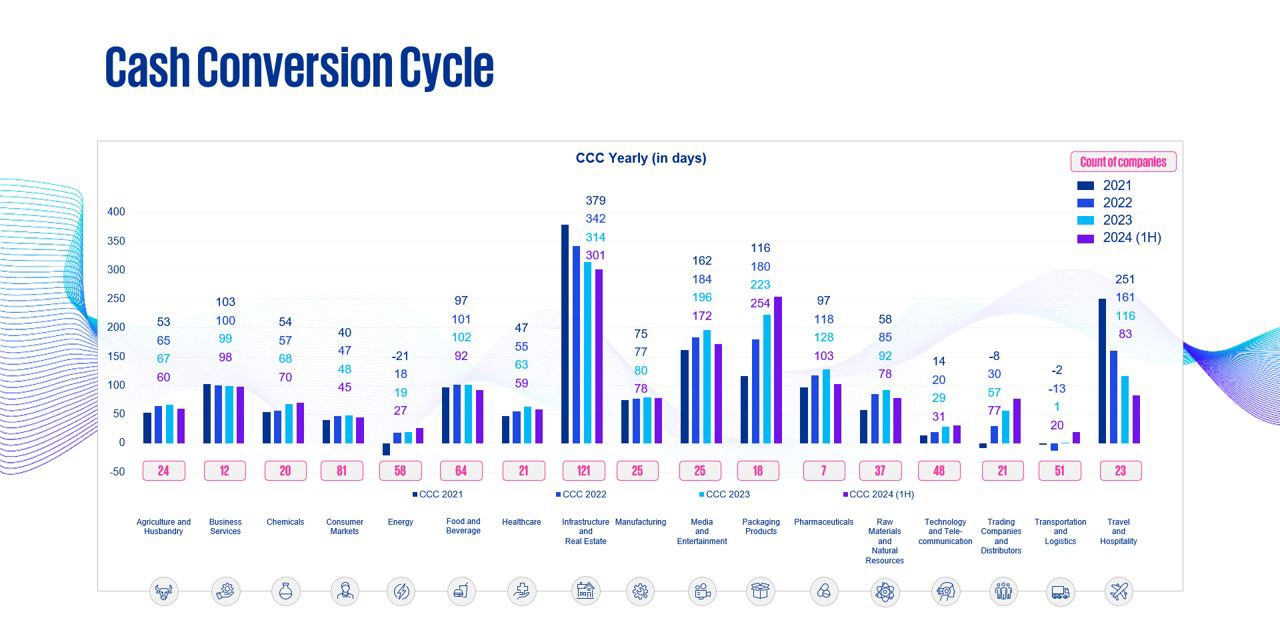
- CCC across the majority of industries has shown improvement, or has at least been stable, since 2021, indicating better cash flow management. However, industries such as product packaging, trading companies and distributors, technology and telecommunications, and energy have shown an increase in CCC, indicating a slowdown in their cash inflow.
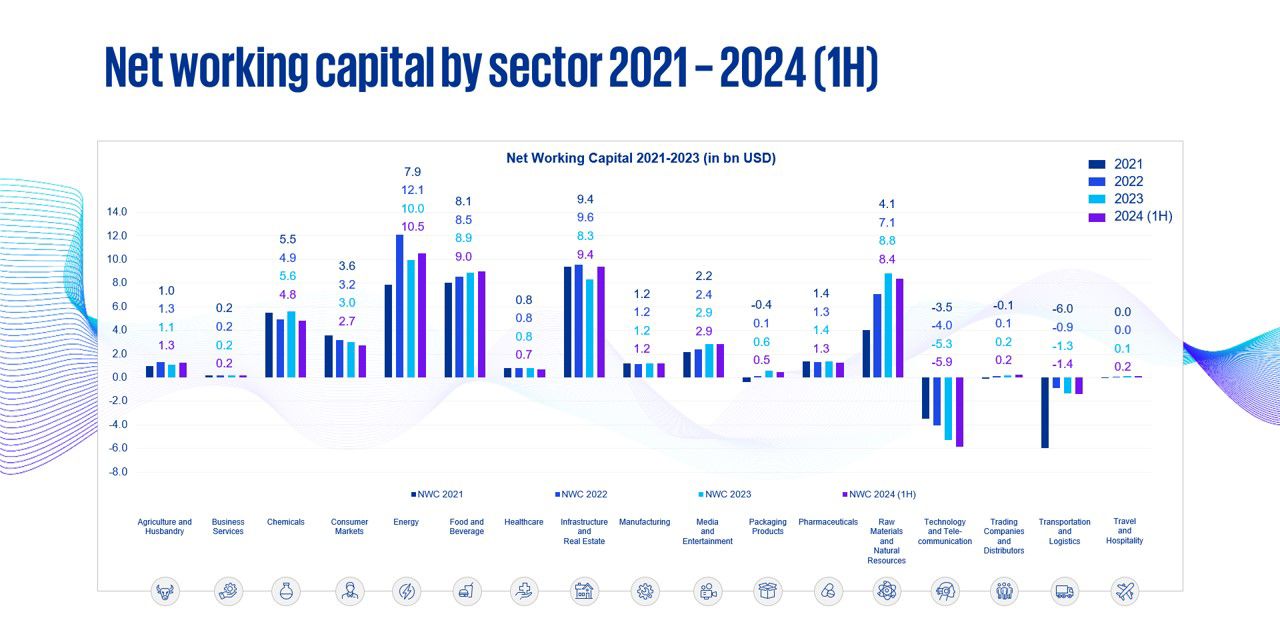
- Declining CCC also aligns with the overall lower NWC levels. However, the raw materials and natural resources sector, as well as transportation and logistics have noticeably greater NWC levels, indicating that they might need to reevaluate their working capital requirements. We also note that the energy industry seemed to be an outlier with significant fluctuations throughout 2021-1H24, likely affected by the change in regulations regarding the transition from coal to renewable energy.
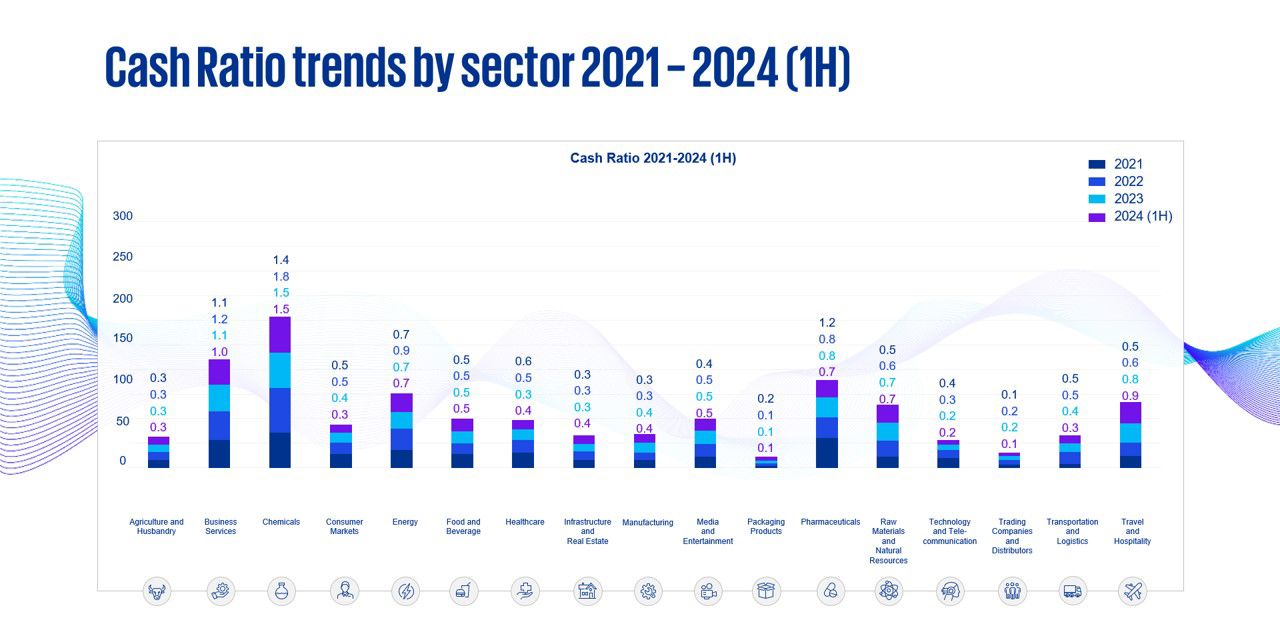
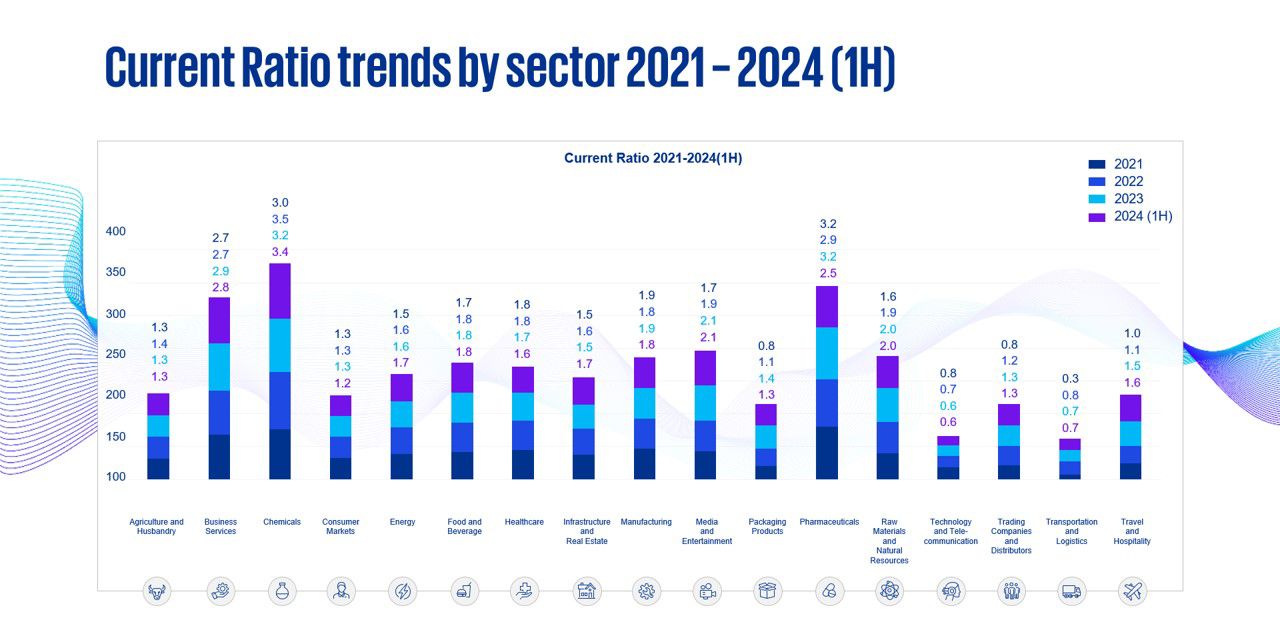
- The cash and current ratios have generally remained steady across the industries, with a couple of notable exceptions. Product packaging as well as transportation and logistics recorded increases in the current ratio which indicates improved liquidity levels, while pharmaceuticals recorded a decrease in the current ratio which might indicate a potential liquidity issue.
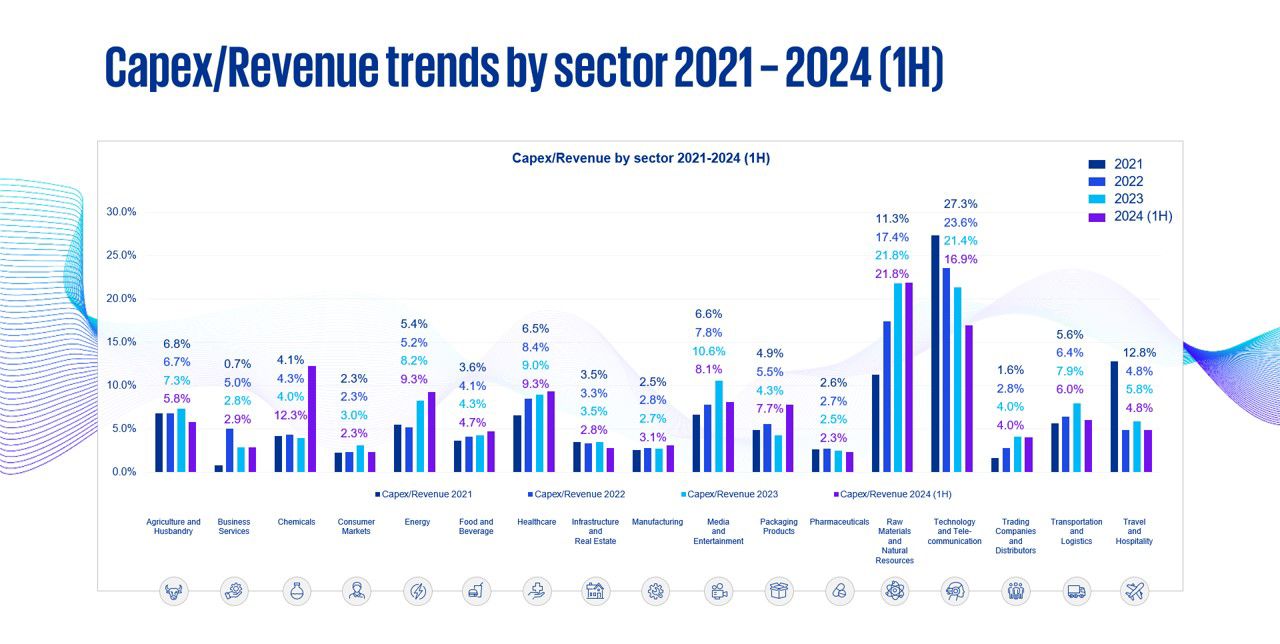
- Capex/revenue generally remained relatively stable. However, there were several outliers that fluctuated significantly, such as raw materials and natural resources as well as technology and telecommunications. Raw materials and natural resources have shown an increasing capex/revenue ratio, indicating that they are investing more in their growth, but their performance has not yet reflected the increased investment. Meanwhile, for technology and telecommunications the capex/revenue ratio decreased.
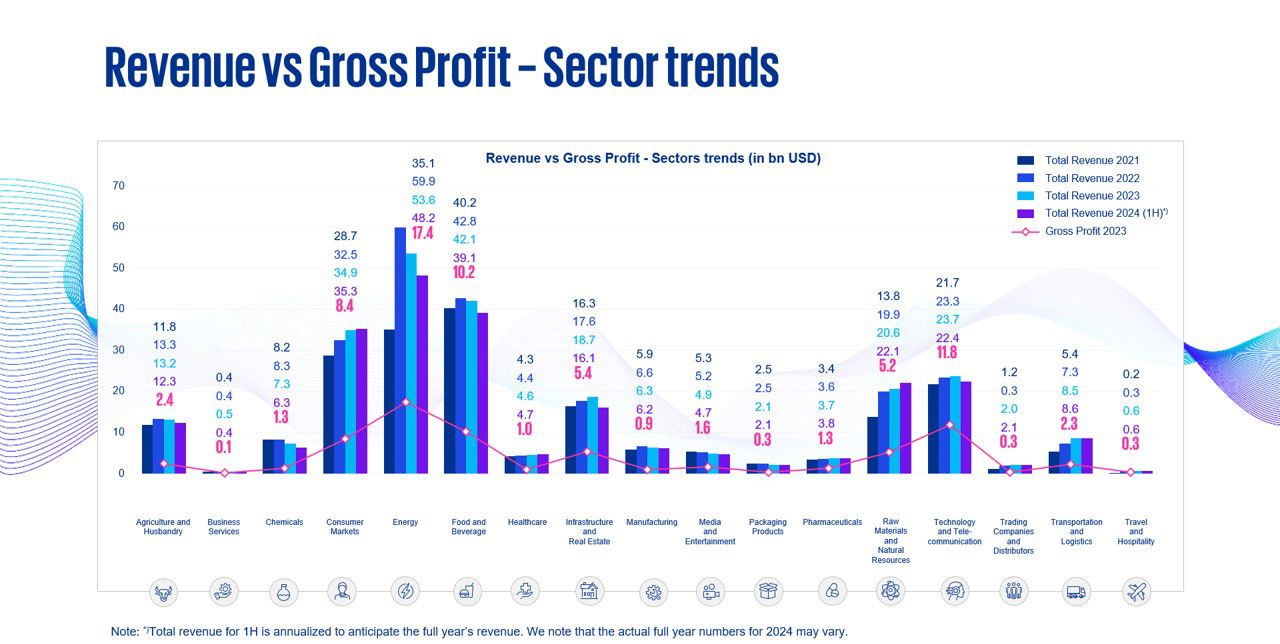
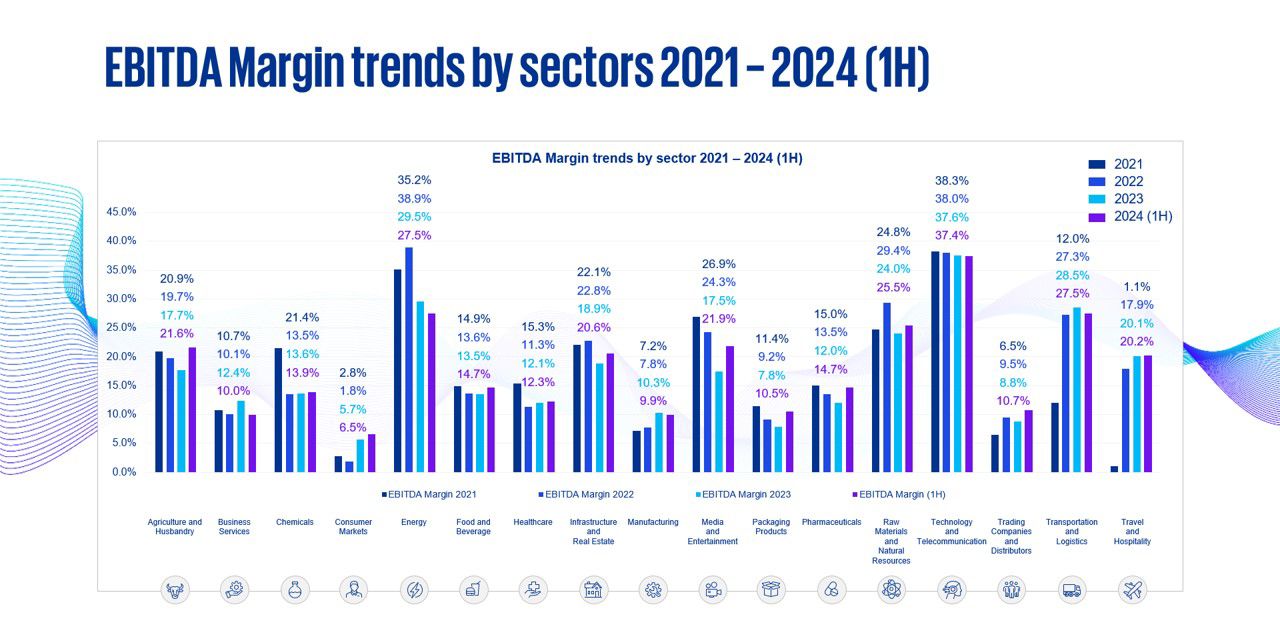
- EBITDA margins have generally improved, resulting in greater profitability. This is most notable in the travel and hospitality industry, which has recovered drastically after the COVID-19 pandemic. However, the energy industry has shown a decrease in their EBITDA margin.
Approach
Context
The effective management of working capital is essential for the financial health and sustainable growth of any organization. By benchmarking performance across various sectors, organizations can pinpoint areas for improvement within their own working capital cycles.
In our recent study, we analyzed the working capital performance of over 780 companies across 18 sectors in Indonesia.
Source
Capital IQ
Segmentation
We’ve reviewed Indonesia’s corporate working capital performance:
- Working capital performance by company size: Small < US $200m, Medium US $200m – US $1bn and Large > US $1bn)
- 1H 2024 sector performance compared to previous years
Outliers
We analyzed the data points through multiple statistical methods such as standard deviation and mean
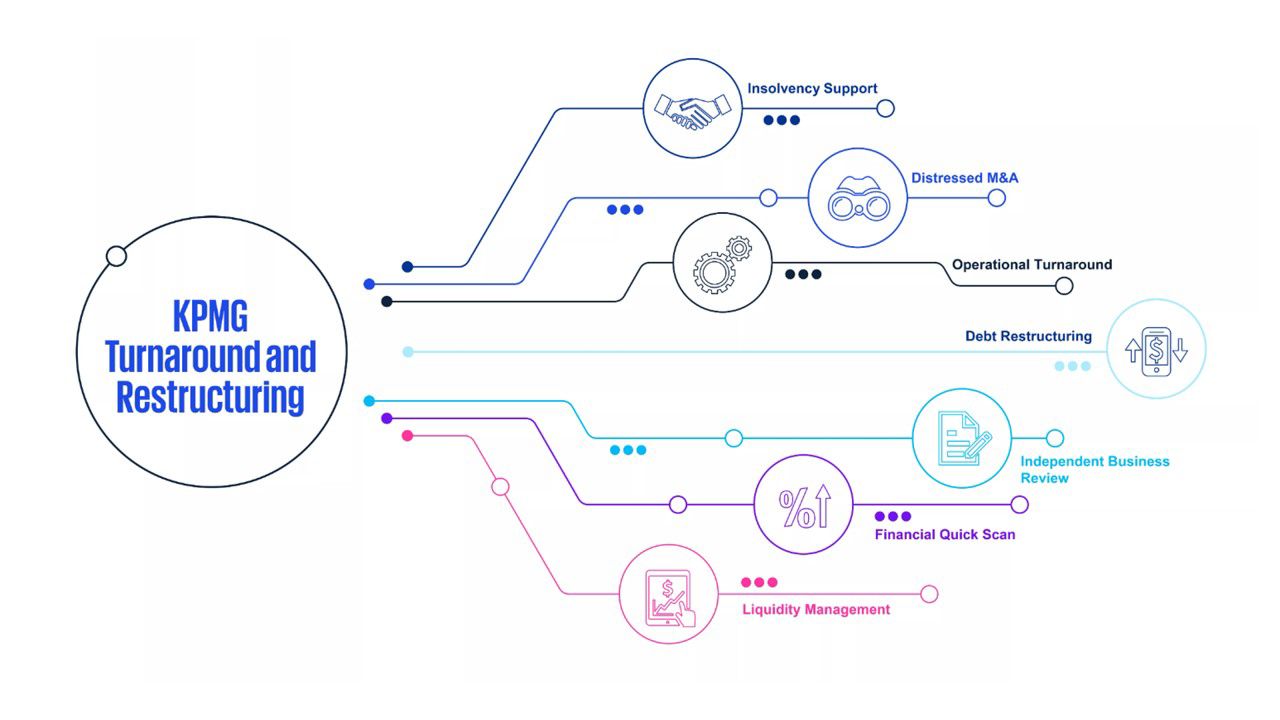
How can we help?
The information contained in this document is of a general nature and is not intended to address the objectives, financial situation or needs of any particular individual or entity. It is provided for information purposes only and does not constitute, nor should it be regarded in any manner whatsoever, as advice and is not intended to influence a person in making a decision, including, if applicable, in relation to any financial product or an interest in a financial product. Although we endeavor to provide accurate and timely information, there can be no guarantee that such information is accurate as of the date it is received or that it will continue to be accurate in the future. No one should act on such information without appropriate professional advice after a thorough examination of the particular situation. To the extent permissible by law, KPMG and its associated entities shall not be liable for any errors, omissions, defects or misrepresentations in the information or for any loss or damage suffered by persons who use or rely on such information (including for reasons of negligence, negligent misstatement or otherwise).