
Market participants’ outlook on the future magnitude, timing, and risk profile of future returns from their investments remain central to asset pricing and valuation models. However, rising geopolitical tensions, mounting fiscal pressures, and the transformative impact of technologies such as AI are introducing new layers of complexity.
Accordingly, this year’s Cost of Capital Study is dedicated to the factors that challenge traditional assumptions and necessitate a more nuanced approach to forecasting and estimating cost of capital and appears under the title “Between Past and Future: Bridging Empirical Yields with Return and Growth Expectations”.
In the current issue, we analyze the relationship between historical and implied returns, focusing in particular on how growth expectations influence implied market risk premiums, while taking into account the implied return requirements of the various markets. In this context, the current issue of the study focuses on the following subjects:
- Europe under pressure: Central bank autonomy, debt and AI innovation will shape the continent’s economic trajectory.
- Empirical returns: Do regional differences persist in the long run
- Estimating implied returns: Are differences driven by risk or growth expectations?

What is the Cost of Capital Study?
The KPMG Cost of Capital Study is an annual empirical survey that provides insights into how current economic developments affect the business models, corporate development and long-term return expectations (cost of capital) of companies in the DACH region (Germany, Austria and Switzerland).
The annual extensive reach of the KPMG Cost of Capital Study underlines the great practical benefit that this study offers for companies.
In the FAQs, you will find explanations of all capital cost parameters.

Cost of Capital Study 2025
Find out how growth expectations and market risk premiums influence the implicit return requirements of the capital markets in the anniversary edition of the Cost of Capital Study 2025.
Current topics and trends
The KPMG Cost of Capital Study is an annual empirical survey that provides insights into how current economic developments affect the business models, corporate development and long-term return expectations (cost of capital) of companies in the DACH region (Germany, Austria and Switzerland).
The annual extensive reach of the KPMG Cost of Capital Study underlines the great practical benefit that this study offers for companies.
Central bank autonomy, debt and AI innovation will shape the continent’s economic trajectory.
Do regional differences persist in the long run?
Are differences driven by risk expectations or growth expectations?
Cost of Capital parameters 2025
WACC
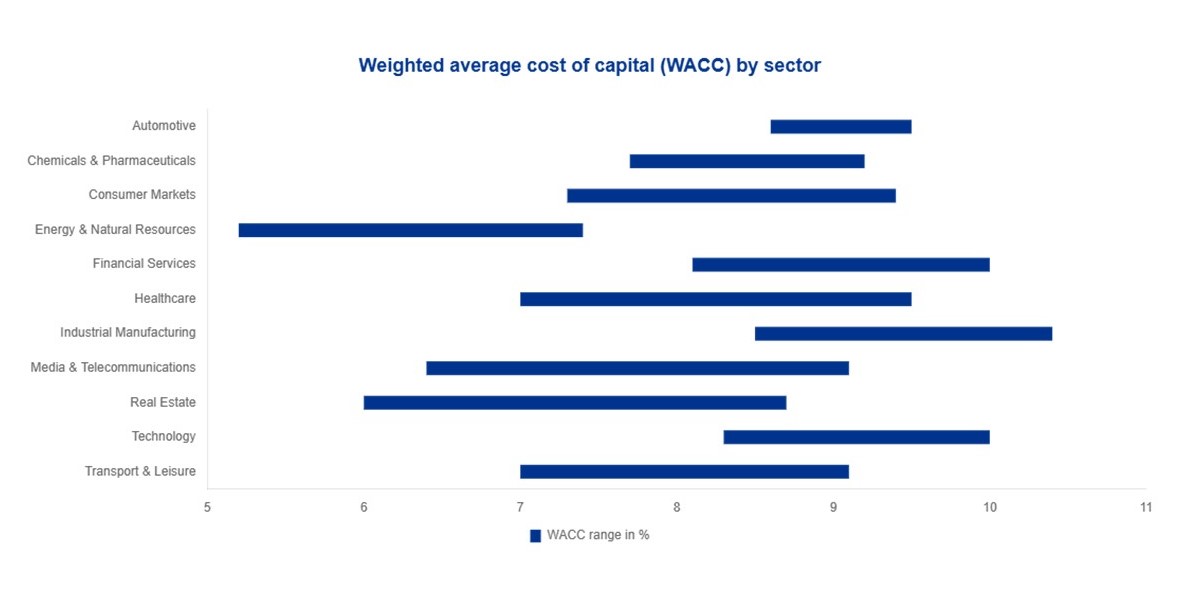
In the current reporting period, participating companies applied weighted average cost of capital (WACC) rates ranging from 5.2 percent to 10.4 percent. The overall average WACC across all industries stands at 8.5 percent, reflecting a slight increase compared to the previous year’s figure of 8.2 percent.
Industries such as Industrial Manufacturing and Technology reported comparatively high average WACC values of 9.4 percent, followed closely by the Automotive sector at 9.0 percent. In contrast, the Energy & Natural Resources sector recorded the lowest average WACC at 6.3 percent, with Real Estate following at 7.0 percent.
Beta factor
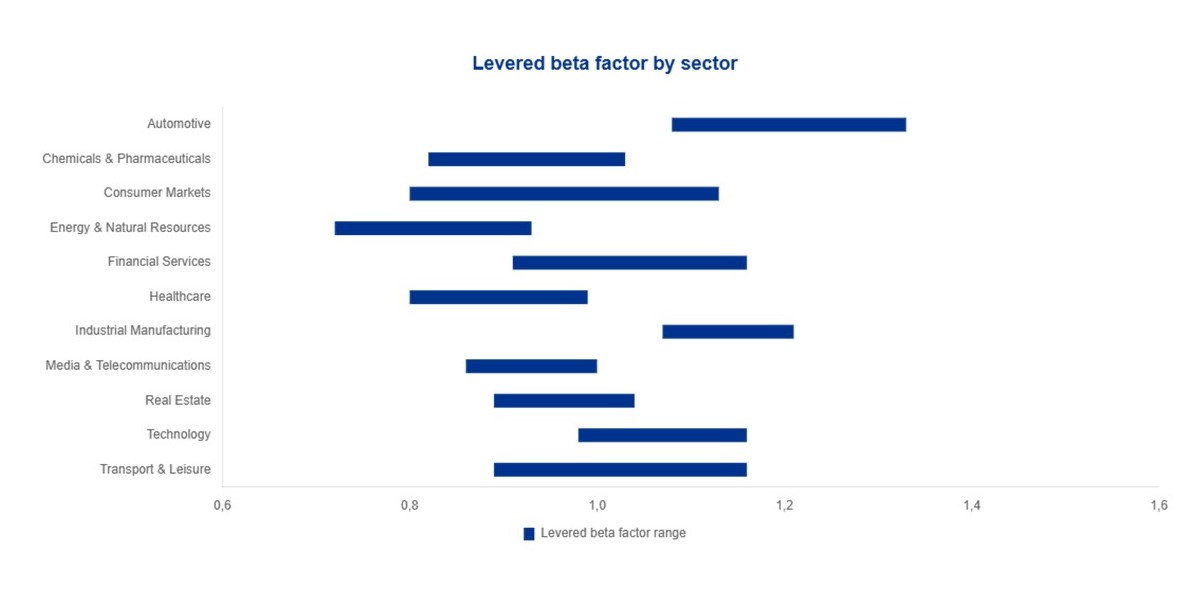
During the survey period, the levered beta factors of all participating companies ranged from 0.72 to 1.33, with an average of 1.03, slightly below the previous year’s figure of 1.05.
The highest average levered beta values were observed in the Automotive sector (1.25), followed by Industrial Manufacturing (1.15) and Technology (1.07). In contrast, the Energy & Natural Resources (0.87), Health Care (0.92), and Chemicals & Pharmaceuticals (0.93) sectors reported the lowest average levered beta factors.
 > Click on the image to enlarge it
 > Click on the image to enlarge it
Total return
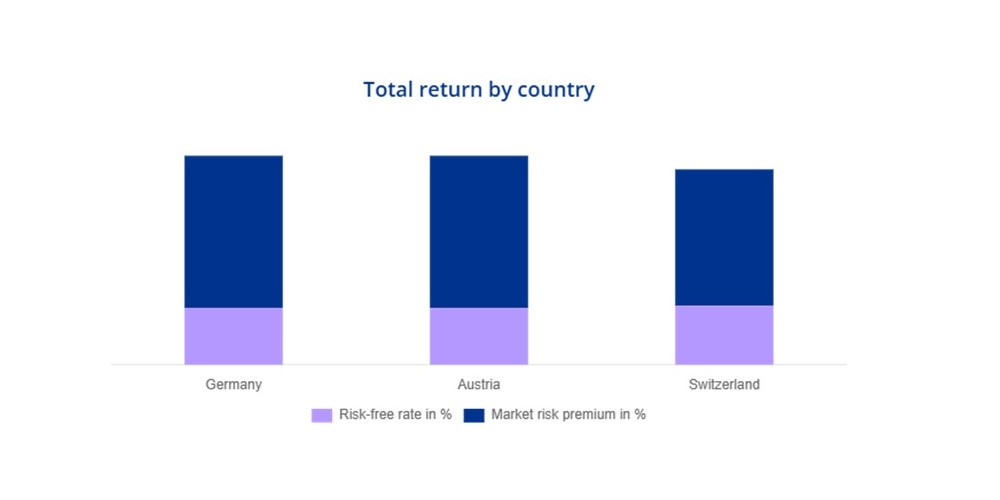
During the survey period, participating companies applied a risk-free rate of 2.5 percent in both Germany and Austria, slightly below the previous year’s rate of 2.6 percent. In Switzerland, the average risk-free rate increased to 2.6 percent, up from 1.8 percent in the prior year.
The average market risk premium applied by companies in Germany and Switzerland declined by 0.1 percentage points year-over-year, to 6.7 percent and 6.0 percent respectively. In Austria, the market risk premium remained unchanged at 6.7 percent.
Based on these figures, the average expected total return during the survey period amounts to 9.2 percent in Germany and Austria, and 8.6 percent in Switzerland.
Cost of equity
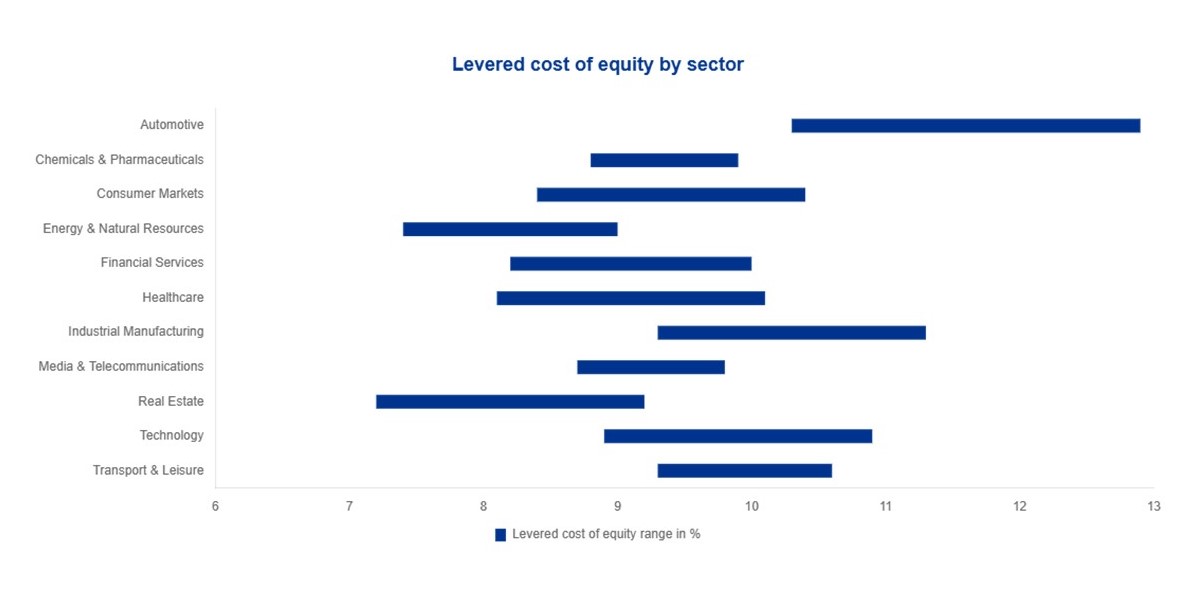
During the survey period, the levered cost of equity reported by participating companies ranged from 7.2 percent to 12.9 percent, with a cross-industry average of 9.7 percent—slightly below the previous year’s figure of 9.8 percent.
The highest average levered cost of equity was observed in the Automotive sector at 11.6 percent.
In contrast, the Real Estate sector recorded the lowest average at 8.2 percent, followed closely by Energy & Natural Resources at 8.3 percent.
 > Click on the image to enlarge it
 > Click on the image to enlarge it
Cost of debt
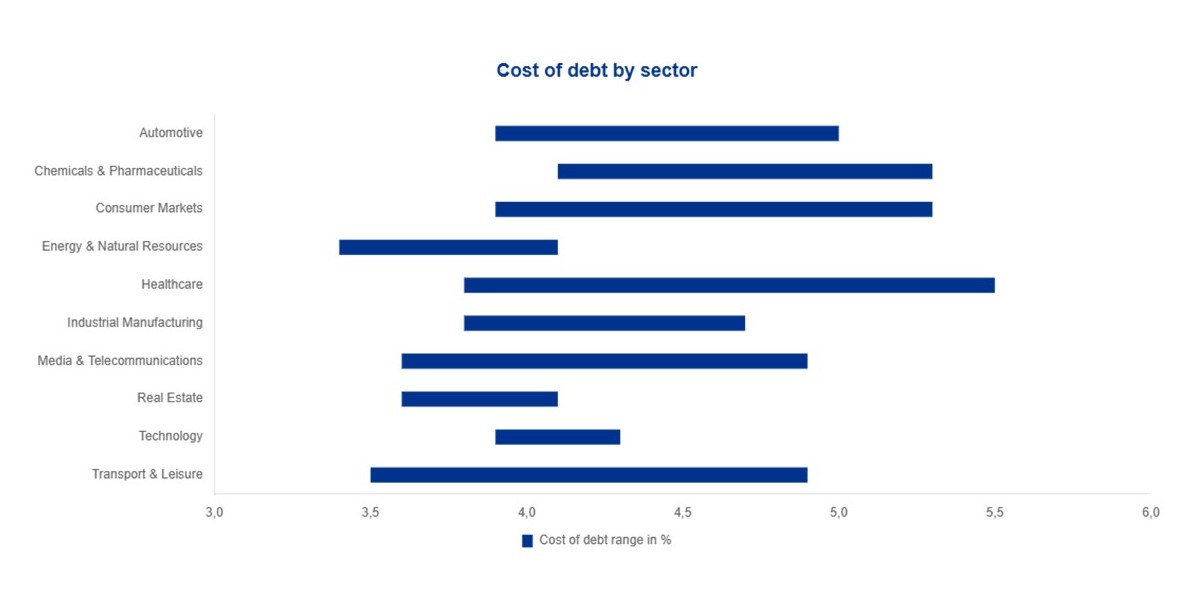
The cost of debt reported by participating companies during the survey period ranged across industries from 3.4 percent to 5.5 percent. On average, the applied cost of debt was 4.3 percent, representing a decrease of 0.1 percentage points compared to the previous year.
The highest average cost of debt was recorded in the Healthcare sector at 4.9 percent, while the Energy & Natural Resources and Real Estate sectors reported the lowest average values, each at 3.6 percent.
Debt ratio
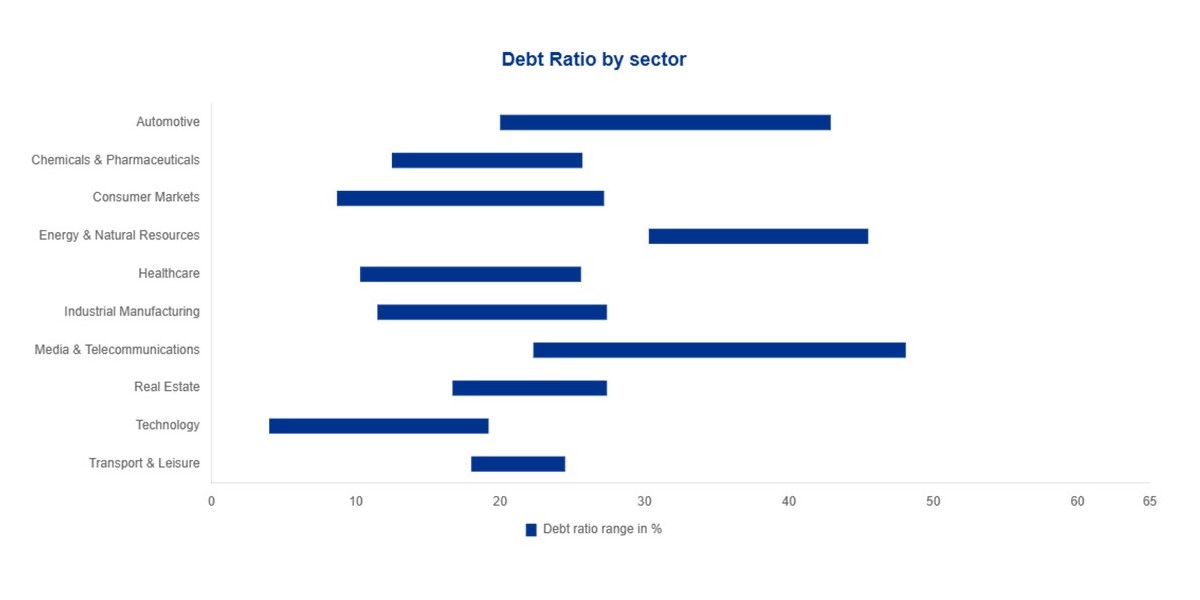
The debt ratios reported by participating companies vary significantly across industries, ranging from 4.0 percent to 48.1 percent. Across all sectors, the average debt ratio stands at 23.5 percent, down from 28.5 percent in the previous year.
The Energy & Natural Resources sector recorded the highest average debt ratio at 37.3 percent, while the Technology sector reported the lowest at 12.3 percent. The relatively high debt ratio in Energy & Natural Resources can likely be attributed to the sector’s substantial capital investment requirements.
 > Click on the image to enlarge it
 > Click on the image to enlarge it
Impairment test
Recognition of an impairment
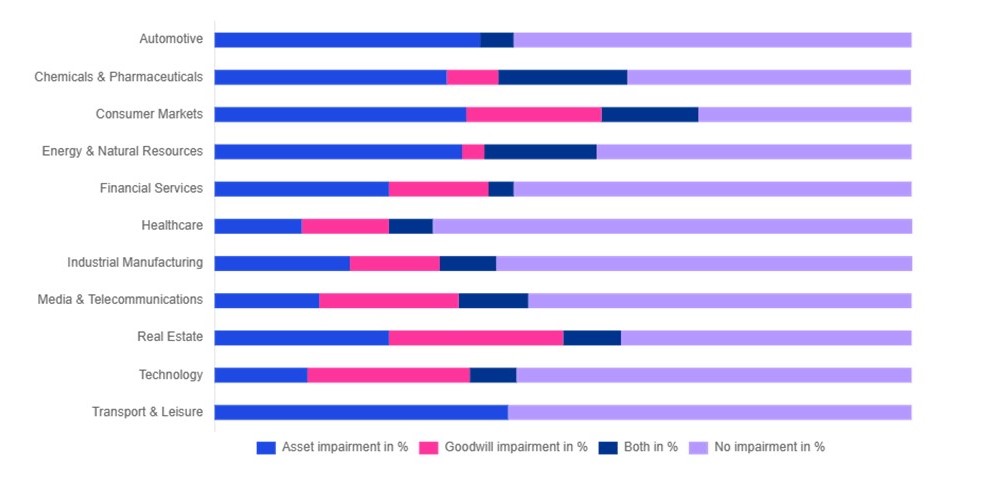
Approximately half of the participating companies (48.1 percent) reported having recognized an impairment, either on goodwill or other assets, during the survey period.
Asset impairments were significantly more common than goodwill impairments.
Most impairments were recorded by companies in the Consumer Markets sector, while the Healthcare sector reported the lowest number of impairments in comparison.
Triggering event
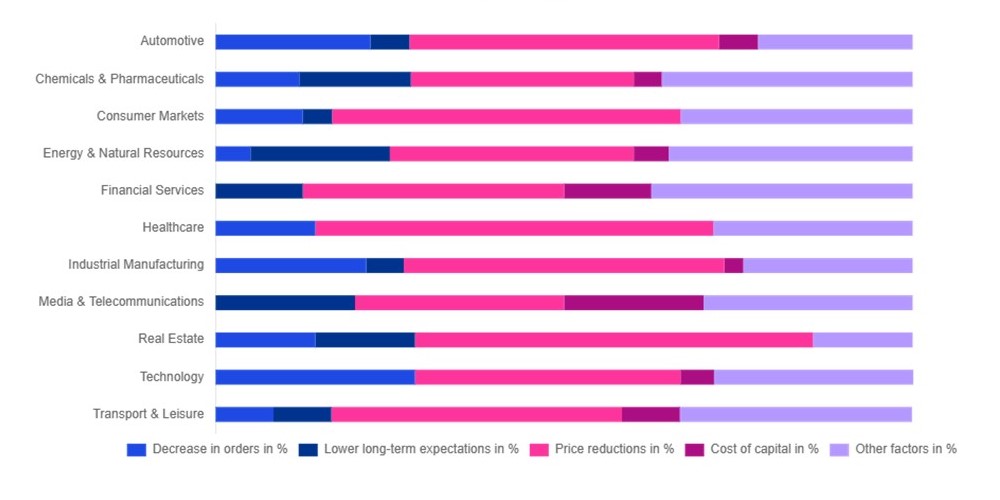
In accordance with IFRS, a goodwill impairment test is conducted annually as part of the financial reporting process. Additionally, around 42 percent of participating companies performed an impairment test during the survey period due to a triggering event. The causes of such triggering events are illustrated in the preceding graphic.
The underlying reasons for triggering an impairment test vary significantly among participating companies and are largely industry-specific. Across all sectors, the most frequently cited reasons include deteriorating long-term expectations and other factors.
 > Click on the image to enlarge it
 > Click on the image to enlarge it
Strengthen your valuation processes with KPMG
Discover how KPMG Switzerland supports executives and finance leaders in making value-driven decisions. From strategic valuation to precise execution, we provide comprehensive expertise.
Our Experts

Related articles and further information
FAQ: What do the cost of capital parameters show?
The weighted average cost of capital (WACC) is the average rate of return required by all investors and is calculated as a weighted average of the cost of equity and debt, where the weights are the respective proportions of the market values of equity and debt in the total company value. The WACC represents the return from an alternative investment appropriate for investing in the company being valued.
The beta factor measures how much an individual security fluctuates in comparison to the market portfolio. It represents the valuation-relevant, company-specific risk measure.
The beta factor is a crucial component in determining the cost of equity. According to the capital asset pricing model, the required return is composed of the risk-free rate and the risk premium, the latter being the product of the general market risk premium and the company-specific beta factor.
The market risk premium represents the return required by an investor for holding a market portfolio above the risk-free rate. It is a part of the investor's required total return, which is explained using capital market pricing models.
The capital market-oriented market risk premium can be determined by calculating the differential return between investments in a representative market portfolio – consisting of risky company shares (stocks) – and risk-free investments. It can be based on both historical and forward-looking data. Thus, the market risk premium is not a parameter that can be directly observed on the capital market.
The cost of equity for a company represents the return that equity investors – investors or shareholders – expect for their investment in the company. To derive the cost of equity, empirically observable capital market returns for corporate investments in the form of stock portfolios are particularly relevant.
These returns compensate overall for the current consumption foregone by shareholders and future monetary depreciation, as well as the assumption of entrepreneurial risks, since an investment in companies and corporate shares is characterized by uncertainties.
Therefore, the total return can fundamentally be divided into a return component for the compensation of the temporal provision of capital – known as the “risk-free rate” – and a risk premium demanded by shareholders due to the assumption of entrepreneurial risk.
The cost of debt refers to the return demanded by debt holders.
The debt ratio is calculated as the ratio of the market value of (net) debt (interest-bearing assets and liabilities) to the market value of total capital.
The total return of the capital market is derived from empirically determined stock returns – both historical and forward-looking – for the representative market portfolio. Using capital market pricing models such as the capital asset pricing model, the total return can be explained and divided into individual components: the risk-free rate and the market risk premium.